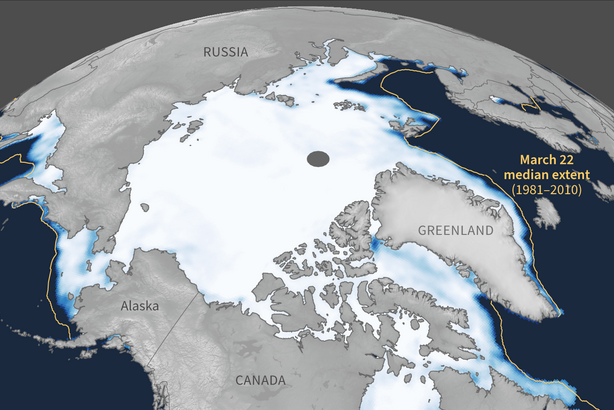
The National Snow and Ice Data Center reports that Arctic sea ice appears to have reached its seasonal maximum extent on March 22, 2025, 10 days later than the 1981-2010 average. Despite the late peak, it was the lowest maximum extent of the 47-year satellite era, which began in 1979.

Sea ice concentration across the Northern Hemisphere on March 22, 2025, ranged from 15 percent (medium blue) at the margins of the ice pack to 100 percent (solid white) in the heart of the Arctic Ocean. The yellow line shows the location of the median ice extent on March 22. Median means “in the middle,” or halfway between the smallest and largest extents on record. The dark circle over the North Pole signifies a data gap; satellites do not pass directly over the poles. NOAA Climate.gov map, based on data from the National Snow and Ice Data Center.
The new record-low winter maximum is part of the long-term trend of shrinking ice cover across the Arctic as a result of global warming. All of the top 10 smallest winter ice extents of the satellite record have occurred since 2007. That pattern is clear in the graph below: the darkest lines are the most recent years, and they sit at the bottom of the stack, meaning they are also the lowest extents.

Each line on this graph shows the daily sea ice extent across the Arctic Ocean and surrounding seas for each year since 1979. Extent means “the total ocean area that is at least 15% ice covered” based on satellite data. Years are color-coded by decade: earlier years are lighter blue, and more recent years are darker blue. The line for 2025 to date, which sits lowest in the stack, is bright pink. The line for 2017 (the previous record-low winter extent) is a darker shade of pink. NOAA Climate.gov map, based on data from National Snow and Ice Data Center.
The graph shows another pattern; the size of the ice pack has shrunk less at winter maximum than it has at summer minimum in September. This is apparent in the amount of spread among the lines in March versus September. This pattern is consistent with computer model predictions, as well as scientists’ expectations. Daily temperatures in the Arctic are mostly well below freezing in winter months, so temperatures can rise and still be cold enough to freeze the surface of the ocean. In the summer, temperatures are much higher, which means even a little bit of extra warming can result in a lot of summer melt. As a result, the rate of decline in September (month of the summer minimum) summer ice extent is 12.1 ± 1.8 percent per decade over 1979-2024. By comparison, the rate of decline in March (the month of the winter maximum) is 2.5 ± 0.4 percent per decade over 1979-2025.
Even though the surface ice extent in winter is declining more slowly than in summer, the winter ice is thinner and more fragile than it historically was. Thinner ice can create both risks and opportunities, according to National Snow and Ice Data Center scientists. On the positive side, thinner ice means easier movement through the Arctic Ocean by ships, though thinner ice may more easily pile up into ridges, which could impede some shipping activities. Wildlife benefits may include easier surfacing by bowhead whales and more sunlight for phytoplankton blooms. Downsides include more dangerous travel over the ice for local communities. Polar bears also rely on sea ice for hunting.
For more details on this year’s Arctic sea ice winter maximum, read the National Snow and Ice Data Center news release. For an update on the 2025 summer sea ice minimum around Antarctica, see our upcoming Event Tracker post. For information about how Arctic and Antarctic sea ice are similar and how they are different, see our feature story, Polar Opposites.
Credit: www.climate.gov


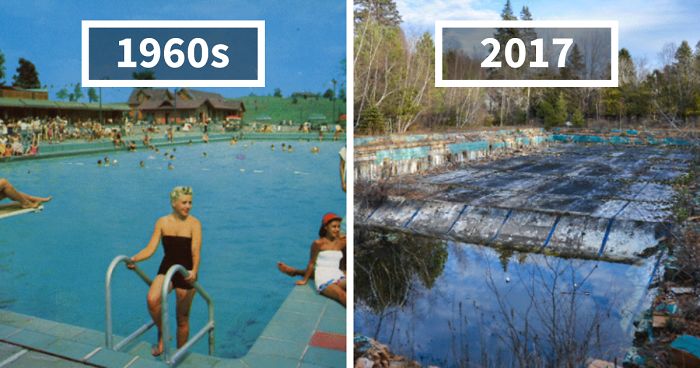 Photographer Finds Locations Of 1960s Postcards To See How They Look Today, And The Difference Is Unbelievable
  Hij zet 3 IKEA kastjes tegen elkaar aan en maakt dit voor zijn vrouw…Wat een gaaf resultaat!!
 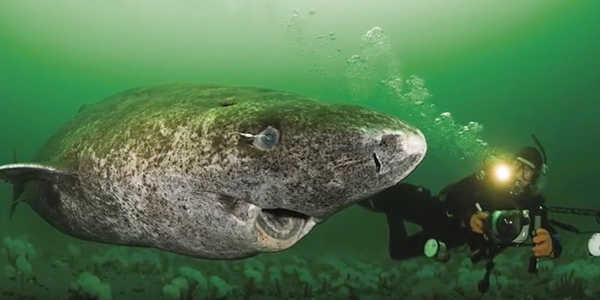 Scientists Discover 512-Year-Old Shark, Which Would Be The Oldest Living Vertebrate On The Planet
  Hus til salg er kun 22 kvadratmeter – men vent til du ser det indvendigt
  Superknepet – så blir snuskiga ugnsformen som ny igen!
  Meteorite That Recently Fell in Somalia Turns Out to Contain Two Minerals Never Before Seen on Earth
  Nearly Frozen Waves Captured On Camera By Nantucket Photographer
  It’s Official: Astronomers Have Discovered another Earth